 By Ed Blount and Aaron Gerdeman (reprinted from 2005, emphasis added in June 2021)*
Since 1980, the cash-based securities lending program has evolved to become the prevalent form of collateral management model in the United States. By 2005, U.S.-domiciled insurers, pension funds, mutual funds and corporate treasurers had securities valued at more than $1.25 trillion on loan. This evolution has not come without difficulties. In the 1990s, securities lenders found that a rising interest rate environment suddenly depressed the value of their cash collateral investments, in some cases to the point of loss when lenders were unexpectedly required to return cash deposits to borrowers. A few lenders sustained losses that exceeded the income they had earned over the course of several years, although in several cases agent lenders absorbed the damages in order to protect their franchises.
Most of the post-crisis auditors focused on the derivative investments that cash managers had selected for their reinvestment pools. Only a few observers noticed that several lenders, holding the same investments in their own pools, were able to escape the difficulties of their peers by deploying the cash from new loans to repay redeeming borrowers. There was no need to liquidate their pool holdings at the time of greatest loss of value for their derivative holdings. That early form of liquidity management was introduced to the market and forged in the crucible of absolute pandemonium.
In more recent years, as the U.S. model has continued to evolve structurally, lenders outside the United States have started to evaluate the additional income opportunities that are available through cash-based securities lending. Based on market experience, most experienced lenders agree that controlling liquidity risk is the most important consideration when lending securities against cash collateral. In anticipation of any such program expansion, program managers and boards of directors should query the cash managers assigned to handling borrowers' collateral, with particular focus on the asymmetric effects that borrower needs and market forces have on the liquidity needs of their lending programs. Simply stated, borrowers will follow considerably different patterns of collateral creation and redemption, resulting mainly from the disparity of their responses to changing market conditions and their own trading strategies. Those differences can lead to tragic consequences for unwary lenders and their cash managers. Risk management begins with an assessment of the asset classes that dominate their lender's program.
Asset class considerations
As a general rule, controlling liquidity risk is more important when lending fixed income securities against cash, if the collateral is to be reinvested in instruments that bear a nondiversifiable exposure to market risk. The fixed value of the cash collateral "peg" is the source of this heightened exposure to liquidity risk in the cash-based lending program. Conversely, when lending against non-cash collateral, i.e., in the form of other securities, especially those sharing some of the characteristics of those which have been lent, there is a tendency for changes in rates to have similar effects on both sides of the transaction. That can create significant pressures on the liquidity of the cash collateral pool in ways that we will describe below.
More situations can arise to impose unmanageable liquidity demands on cash collateral pools derived from fixed income loans because the conditions that prompt borrowers to return the former in large volumes can develop not only from changes in level of interest rates, which control borrower rebates, but also from changes in the shape of the yield curve itself. The latter affects the value of both the bonds on loan and those instruments in which the cash collateral has been reinvested. In addition, fixed income securities are generally lent on larger tickets than equities, giving rise to the possibility of a magnified effect. Furthermore, the effects of rate changes on fixed income lending programs are relatively more direct and abrupt, since equities are generally less responsive to changes in interest rates than are fixed income securities. The price of a fixed income security is directly affected by the prevailing interest rates in the relevant market, as well as the time left to the redemption of that security. The closer one gets to redemption date, the less sensitive to price of the bond in response to interest rate changes. This has a material influence on the planning model used by the cash manager for the securities lending program.
In the following paragraphs, we will examine a set of market scenarios that illustrate how changing market conditions can have a greater effect on the lending program for fixed income securities than for equities; and we will also examine an historical market condition which led to liquidity stresses that were managed efficiently by a major institutional lender at the end of calendar 2004.
Market scenarios
Changing conditions can affect the liquidity requirements of lending programs for equities and fixed income securities to considerably different degrees. The primary factors to be considered are a) rising interest rates and b) shifts in the shape of the short and long-term yield curves from positive to flat or negative. These rate and shape factors are important because portfolio managers and hedge funds with short positions in fixed income securities will respond to changing market conditions by adapting their trading strategies and modifying their needs for securities loans. This has a consequential affect on their relationship managers at financing prime brokers, who will in turn change their rebate expectations in dealings with lenders of widely held fixed income securities. As noted above, those expectations are more sensitive for loans of fixed income securities than for equities.
To anticipate sudden, unmanageable demands for redemption of cash collateral, lenders must understand the circumstances under which the borrowers would adopt wholesale changes in their own trading strategies. The most challenging circumstances involved those market conditions in which interest rates rise coincident with a positive shift in the yield curve, while the most benign are those where rates fall and the yield curve moves negative. There are a number of intervening situations, for which the volume and value effects are outlined in Table 1. Similarly, the immediate stresses from cash flow and income effects are outlined in Table 2. While the dynamics of these two tables are related, the eventual damage to portfolio values (Table 1) can be mitigated by skillful management of cash flows (Table 2), a circumstance typified in the mid-1990s example given in the opening paragraphs.

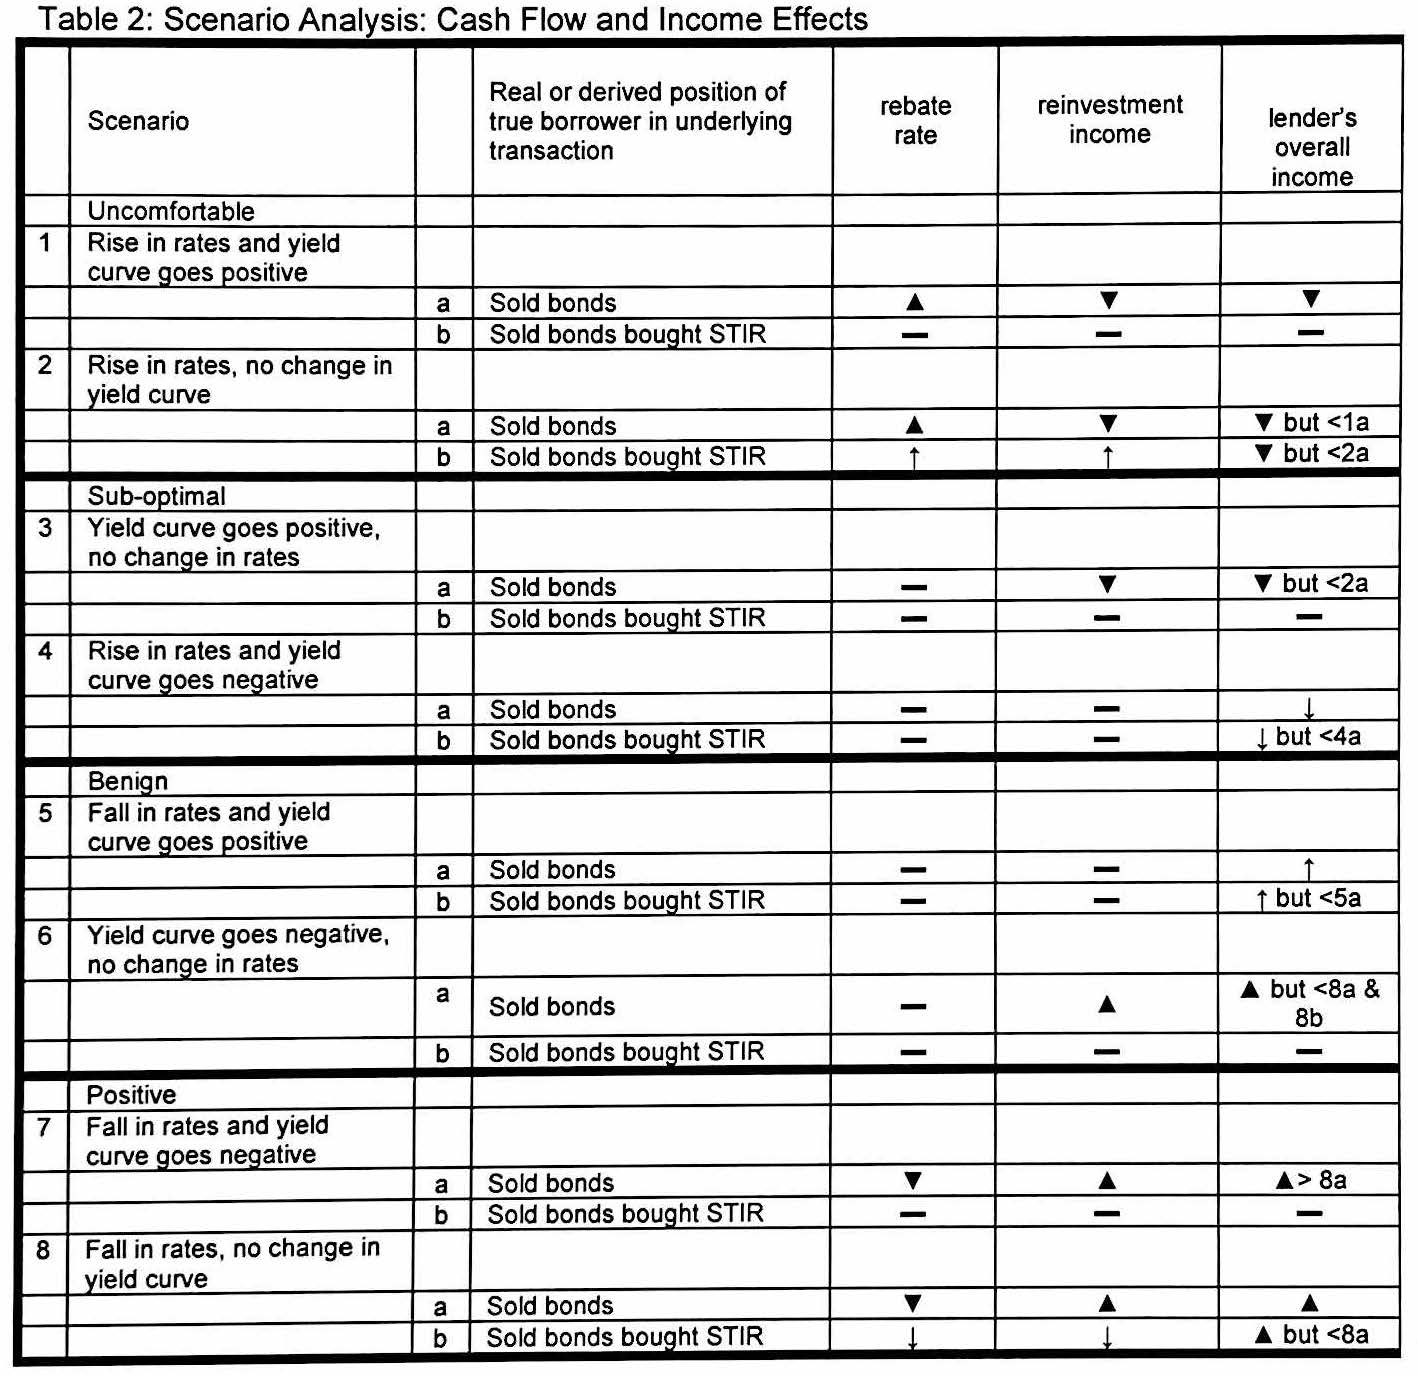
We can see from the scenarios set out above that the stresses would be greatest when there is a rise in rates and a steepening of the yield curve. Fortunately, this is not a normal situation. Usually, as rates rise the curve flattens. The market has seen this effect in USD interest rates in the recent past when the Fed Funds rate was continuously rising: March 1988 to July 1989; April 1994 to May 1995 and July 1999 to December 2000. Nevertheless, when rates are generally rising, as in each of these periods, the income of lenders comes under pressure and liquidity pressures associated with demands for the return of cash collateral becomes greater. These effects are more pronounced for those directional borrowers who have gone short of the long end of the curve than for those arbitraging (most commonly short of the long end while being at the same time long of the short end). A rise in short term rates, coincident with a flattening yield curve, could add to a lender's difficulties if cash collateral had been invested in longer maturities and/or in more illiquid instruments.
Loan distribution
In addition to the effect of changing market conditions, there are considerable differences in the characteristics of loans for different asset classes and market sectors. These can also create unmanageable liquidity stresses, resulting from unanticipated demands for return of cash collateral. In 2004, ASTEC Consulting's survey of financing market participants found that the volatility and size of loans, relative to volatility factors, can vary greatly based on an analysis of proprietary historical data:
- Loans of non-US fixed income securities were more volatile than loans of non-US equities, although volatility was similar for U.S. securities. ASTEC found that the former displayed a 22.1% coefficient of variation versus 12.7% for the latter;
- Transaction tickets involving non-US fixed income securities were about 10 times larger than those for loans of non-US equities though the former may be subject to a certain amount of aggregation; and
- Loans of non-US equities were open on average 3 times longer than were loans of non US fixed income securities.
- The average nondollar, non-cash equity loan was about $2.5 to $3 million, while the average sovereign, fixed-income securities loan ticket was about $20 to $30 million.
Clearly, these loan transaction dynamics must be taken into account with the composition of their own loan portfolio by cash managers when planning for their strategic liquidity requirements. Furthermore, the dispersion and volatility of borrowers' balances over time must be weighed using a conventional value at risk methodology, in order to determine the likelihood of an unexpected surge in redemption demand. If possible, the VaR for an individual portfolio of borrowers should be examined within the context of measured volatility for the same borrowers acting as counterparties to other lenders and the volatility of the entire loan market as a composite. This larger perspective will be useful in helping cash managers understand whether their historical experience is a reasonable basis for projecting future demands for redemption by borrowers acting within a very complex market environment.
Controlling value at risk for pool liquidity
The concept of value at risk (VaR), which is used widely to estimate the market and credit risks of trading portfolios, can also be used to describe the liquidity risks of securities lending programs. With knowledge of the borrowing and returning patterns of each securities borrower, lenders can better manage their program expectations and policies. For example, if a fund places a large portion of its loans with a broker who has a history of making large and sudden returns, then to manage for a potential liquidity crunch that lender might consider options such as:
- reinvesting a larger percentage of the cash collateral offered by that more-volatile borrower in very short term instruments, averaging down the weighted maturity of the pool, while paying a lower rebate to the borrower in order to make up for the lower spreads resulting from the lower yield on collateral;
- or, keeping easy-to-lend assets in reserve, should the need to generate new loan balances arise.
Established risk measurement techniques can assist lenders in anticipating changes in exposure resulting from volatility in borrower returns. Since liquidity risks in securities lending are specific to the abrupt decline in loan balances (increases are not a problem, except to the extent that lending 100% of easy-to-lend assets will preclude the possibility of generating new loans to escape a liquidity crunch), VaR is an ideal risk measurement because it focuses on losses while ignoring the volatility of gains.
Without going into the technical detail that would be outside the scope of this chapter, VaR can be defined as follows: Value at risk (VaR) is a statistical method that forecasts the magnitude of a negative change to some value (e.g., a portfolio of assets) that likely will not be exceeded within a certain amount of time. In other words, today's VaR (say, $1,000,000) tells you that if your portfolio declines in value today that the decline probably (say, with 95% likelihood) will be less than the VaR amount. VaR models are used in this way by managers of portfolios of all kinds of liquid assets, bank regulators across the globe, and even securities lenders to measure the market risks and credit risks in their portfolios. Some beneficial owners might be accustomed to seeing VaR statistics on monthly or quarterly reports produced by their lending agent banks. Those VaR statistics relate to the volatility of the price of the assets that form the principal of the loan (such as volatile equities) as well as the relatively low-risk assets in which the cash collateral is reinvested. By focusing on the volatility of cash redemptions made by borrowers, one can extend the traditional application of VaR to liquidity risks in securities lending.
To illustrate the use of VaR to measure liquidity risk, consider the following hypothetical example of two brokerages borrowing from a single beneficial owner. To analyze the brokerages' patterns of cash deposits and redemptions, first calculate the net change in each borrower's collateral balances from day to day. Plotting the frequency distribution of historical fluctuations in collateral balances over a sufficient time period, such as one year, reveals trends in the shifting size of the relationship between lender and borrower. In Chart 1, we see that Borrower ABC has on a few occasions increased its borrowings by 50% or more but has never redeemed more than half of its collateral on one day. As would be expected, on most days the net change in collateral/loan balances is less than 5% up or down. In Chart 2, we see that Borrower XYZ also tends to keep its balances with the lender within +/- 5% of the prior day's amount. However, this borrower exhibits significantly more volatility in its cash redemptions (and deposits). In fact, on several days the lender was required to return large portions of Borrower XYZ's collateral. VaR provides a simple way of summarizing this analysis in one number that can be used by the lender to prepare for sudden redemptions of a certain size.
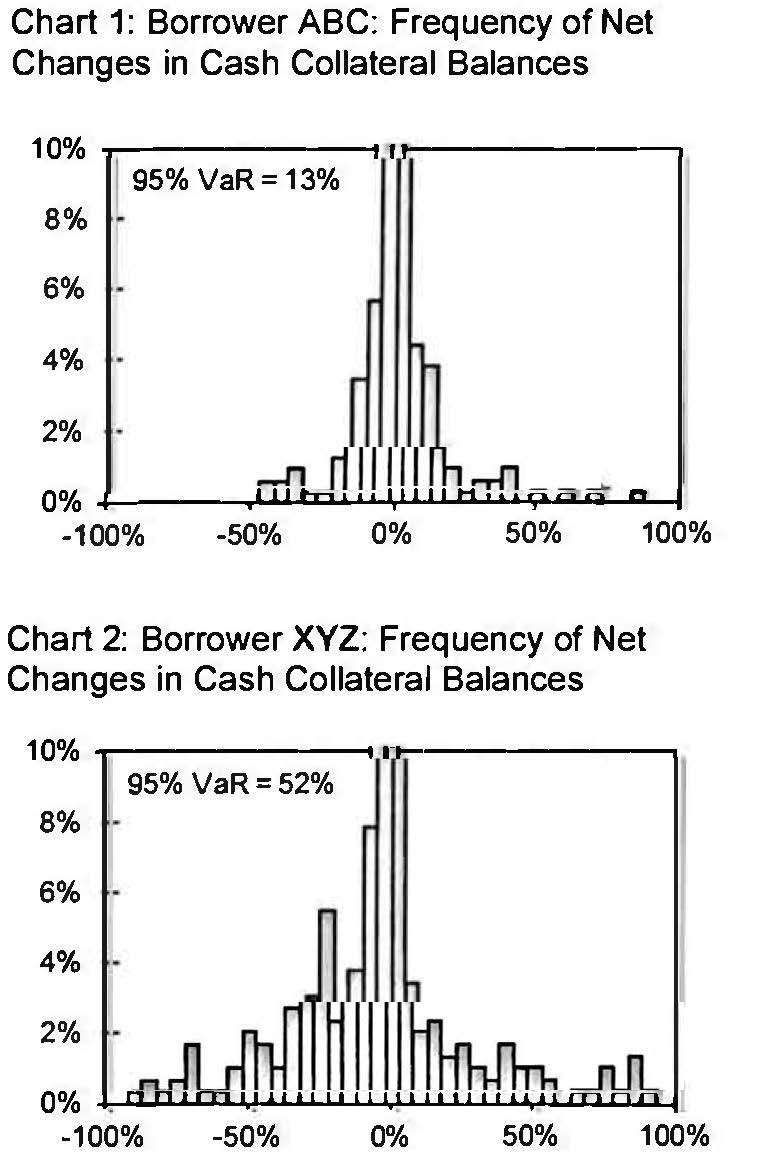
Note: These charts show, for a hypothetical example, the relative size
and frequency of collateral withdrawals made by each borrower.
Collateral redemption VaR was calculated for the 95% confidence
interval. The collateral VaR is an estimate of the probability of large
collateral redemptions over the previous 15 months.
This historical VaR analysis tells us that Borrower ABC has a 95% collateral redemption VaR of 13%; that is, the lender knows that Borrower ABC usually (95% of the time) either increases loan balances or redeems no more than 13% of its cash collateral. Either way, this suggests that the lender's relationship with Borrower ABC is fairly stable and therefore has low liquidity risk. Conversely, Borrower XYZ has a 95% collateral redemption VaR of 52%; that is, the lender knows that Borrower XYZ usually (95% of the time) either increases loan balances or redeems up to 52% of its cash collateral. This indicates a high frequency of negative net changes in collateral balances that necessitates the lender selling off cash collateral reinvestments or generating new loans to raise the cash. Thus, Borrower XYZ has higher liquidity risk.
Such an analysis of the size and frequency of collateral redemptions made by borrowers' yields information important to understanding and managing liquidity risks in securities lending. It cannot indicate the reason for a borrower's relative stability or volatility, which in the case of prime brokerages could derive from the mix of trading strategies employed by its hedge fund clients, but it does describe the effects of such influences. As we will see in the following case study, large, unexpected returns of cash collateral are a part of the business of lending. Knowing the extent to which a particular borrower tends to rebate significant portions of his collateral, whether to a specific lender or to a representative group of lenders, assists beneficial owners in their management of liquidity risks by measuring the size of the risk and identifying the sources of the risk.
Case study
A case study illustrates the reality of liquidity risks in securities lending and the benefits of proper management of those risks. In December 2004, several million dollars worth of a handful of stocks were on loan to a major prime broker from a large mutual fund complex. The institutional lender acting as an agent for the beneficial owner expected these loans to remain open until nearly the close of the month, but the broker completely returned his positions in these equities on a single day about a week before Christmas.
This sudden return of the borrower's loans triggered the redemption of more than half of the broker's cash collateral deposits (all of which had been reinvested, of course), representing at the time a major portion in the lender's total loan balances because the lender had reallocated positions away from low-margin borrowers and shifted a high portion of its loan portfolio to this one broker. Fortunately, the lending agent's ability to generate sufficient redeployment liquidity helped this event pass without incurring losses. No comment was made about the damage to the relationship between the fund complex and the first broker-dealer.
This successful aversion of investment loss was possible because instead of dumping collateral investments before maturity, the lending agent was able to redeploy a large block of securities to a second prime broker. Faced with the unexpected block redemption, the agent had evaluated its stable of borrowers and assets in reserve to promote the best match, locating securities that which would not only be initially attractive to a credit-worthy broker-borrower; but also a sufficiently good fit to the broker's customer, a large hedge fund, to remain in a loaned-out position for several weeks. Still, this happy conclusion might not have been possible, especially during the year-ending period when securities firms sometimes unwind positions in order to 'window-dress' their balance sheets, if the lender's agent had not developed a set of insightful relationships with broker-dealers as well as with their hedge fund customers' strategies. Relying on these insights, the agent made enough new loans to generate the cash needed to deliver the necessary collateral to the redeeming broker without collapsing its collateral pool.
As is often true in capital markets, a prior investment in relationships facilitated the core investment process, as the lender benefited from its agent's ability to solve the need for liquidity through the latter's relationship with the second borrower and the insight that both the agent and the broker had of the hedge-fund's strategic needs.
Counterparty trading strategies
We have described above the exposure that lenders bear to the asset class of the instruments provided to their borrowers. In the examples and scenarios described, the risks from those exposures are magnified by the influence of changing market conditions on the value of the assets held in short positions of the trader-borrower. As we have seen, fixed income loan balances tend to have greater sensitivity to changes in interest rates than do comparable values generated in loans of equity securities. However, the manner in which the trader-borrowers use these assets is also quite significant for risk management, as shown in the case study and described below.
If trader-borrowers manage their loans to satisfy the requirements of their trading strategies; and if market conditions are the greatest influence on the traders' strategies; then lenders must be cognizant of the borrowers' underlying strategies and in particular their resulting sensitivity to changes in market conditions. However, the underlying strategy (or "style", as the term is used by analysts) of the trader-borrower can be even more significant for liquidity risk management than the asset class employed in the implementation of that strategy. For example, trading strategies employing large volumes of assets in long-short positions, such as those typical in statistical arbitrage funds, can lead to dramatic shifts in the cash collateral balances of lenders who cultivate relationships with these borrowers. Once the target yield for a paired long-short position is attained, the trader often closes out the borrowed position and subsequently redirects trading capital into another position. This closeout/redirection can be quite precipitous, particularly for the lender's cash manager.
Although the assets in arbitrage funds may be relatively easy to borrow and on-lend in the securities financing markets, the rapid withdrawal of a large percentage of the cash pool's deposits may also come at an awkward time for the lender. If the next implementation of the trader-borrowers' follow-up strategy is directed through another prime broker, the lender's agent may be attempting to redistribute the returned the securities into a saturated market. By contrast with the high-volume, but highly-volatile balances of lenders dealing with arbitrage funds, those lenders who deal with fundamental short-sellers may have relatively stable and enduring balances, since the positions created by these strategies often endure for months or even years. If the lender is aware of the anticipated stability of these balances, and consequently lower liquidity risk, the borrowers' cash may be invested in a pool with far more aggressive instruments, at the same time that the cash pool may be structured in a portfolio with a far longer duration and weighted average maturity (WAM).
Despite the liquidity advantage that accrues to lenders dealing with fundamental short-sellers, some lenders may be reluctant to lend to traders whose perceived interests and pessimistic viewpoints are at odds with the optimism of the original long-side portfolio manager. Ironically, the eventual reversal of the fundamental short sellers' position, effected by a purchase and return of securities with a consequential demand for redemption of cash balances, usually comes when the market price of the security borrowed has declined sufficiently to offer a capital gain to the short seller. This can create liquidity exposure to the lender's cash manager, especially if the redemption was unanticipated, but coincidentally the repurchase of securities will prevent further erosion of the market price for the security being returned to the portfolio of the original long side investor, usually cushioning the price fall.
The above examples rely on only two of the more than two dozen recognized strategies employed by short-sellers in contemporary markets. Each short-seller's strategy creates trading patterns which vary the resulting value and volume of their borrowing needs in harmony with the direction, volatility and predictability of market conditions. The complexities of the trading strategies means that the year-to-year, even quarter-to-quarter demands of an arbitrage or fundamental short sellers can change dramatically as markets change. Ultimately, each short seller's strategy also creates distribution and redemption footprints, i.e., liquidity patterns, in the cash pools of their lenders, which in itself creates a consequential need for their lenders' cash managers to reinvest the collateral into instruments with less-correlated value and volume vectors.
Conclusion
In the mid-1990s, cash managers working for securities lenders suffered losses as a result of the derivative assets selected for their investment pools. In the future, it is likely that lenders' losses will also be a function of derivative investments, although the loss is more likely to be a derivative function of unexpected liquidity demands, resulting from the investment demands of borrowers strategies, not of cash managers' pool asset values. In effect, the modern derivative exposure will be to changes in the trading strategies of the ultimate borrower, i.e., the hedge fund or proprietary trading desk. Therefore, the lender's ultimate exposure to loss in a modern securities lending program results less from the counterparty's credit profile, although that remains important, than from the market risk which results from the counterparty's trading strategies.
____________________________________
* Originally published as "Managing Liquidity Risks in Cash-based Lending Programs," Chapter 7 in Securities Finance: Securities Lending and Repurchase Agreements, Frank J. Fabozzi and Steven V. Mann, editors, John Wiley, publisher, New York, 2005, available on Amazon. REPRINTED WITH PERMISSION.
Download this article